Push Help Center
Ready to help
Ingesting events using Azure Monitor and Microsoft Sentinel
In this section
- Modern integration
- Set up Azure Monitor resources
- Find your app registration details
- Find your logs ingestion URL
- Find your DCR details
- Configure the integration in Push
- Verify it's working
- Legacy integration
- Create a Log Analytics workspace
- Retrieve keys from Log Analytics workspace
- Configure the integration in Push
Modern integration
Push can deliver events to Microsoft Sentinel using the Azure Monitor Logs Ingestion API. Events are written to a custom table in your Log Analytics workspace, where they're available to Microsoft Sentinel — including the Microsoft Sentinel data lake, which mirrors the table automatically if your workspace is onboarded.
To connect Push to Microsoft Sentinel, you'll need:
Client ID
Client secret
DCR immutable ID
DCR stream name
Endpoint URL
Tenant ID
Set up Azure Monitor resources
Follow Microsoft's tutorial on how to send data to Azure Monitor Logs with the Logs ingestion API. This will allow you to create a Microsoft Entra application with a client secret, a data collection endpoint (DCE), a DCR-based custom table in your workspace, and a role assignment granting the application Monitoring Metrics Publisher on the data collection rule. Note: The role assignment can take up to 30 minutes to take effect.
Important! When creating the data collection endpoint (DCE), make sure it's in the same region as your Log Analytics workspace. A DCE in a different region can't be used with your workspace's data collection rule.
Push's setup differs from the tutorial in two places:
If the portal asks you to choose a table plan, choose Analytics. This keeps events queryable in real time and usable in analytics rules.
When the tutorial asks you to upload sample JSON to define the table schema, use the Push event schema below instead of Microsoft's generated sample data, and skip the PowerShell steps entirely. Because the sample includes a TimeGenerated field, no transformation is needed. Leave the default source transformation as is.
JSON docs example for modern integration - Microsoft Sentinel
JSON[
{
"version": "1",
"id": "00000000-0000-0000-0000-000000000000",
"TimeGenerated": "2026-07-01T14:52:00+00:00",
"tenantId": "00000000-0000-0000-0000-000000000000",
"eventObject": "EXAMPLE_OBJECT",
"friendlyName": "Example Object",
"category": "ENTITY",
"description": "Contrived maximal event used only to define the table schema.",
"eventType": "UPDATE",
"actor": { "exampleNestedKey": "exampleNestedValue" },
"new": { "exampleNestedKey": "exampleNestedValue" },
"old": { "exampleNestedKey": "exampleNestedValue" }
}
]Find your app registration details
In the Azure portal, go to App registrations and select the application you created.
The Overview page shows your Application (client) ID and Directory (tenant) ID — these are the Client ID and Tenant ID in Push.
For the client secret, go to Certificates & secrets and copy the Value of your secret. Create a new secret if you didn't note it at creation — the value is only shown once.
Important! Note your client secret's expiry date and set a reminder to rotate it before then. When the secret expires, event delivery stops and there's no warning in Azure. The only sign is delivery errors in Push's webhook debug log.
Find your logs ingestion URL
Go to Data collection endpoints and select the endpoint you created. The Overview page shows a URI labelled Logs Ingestion — this is the Endpoint URL in Push.
Enter just the scheme and host, for example https://my-dce-a1b2.eastus-1.ingest.monitor.azure.com, with no path or trailing slash.
Find your DCR details
Go to Data collection rules and select the rule you created.
The Overview page shows the Immutable ID. Be sure to include the dcr- prefix when copying it into Push.
The DCR stream name is always Custom- followed by your table name, for example Custom-PushEvents_CL.
To confirm it, open JSON View on the rule's Overview page and copy the key under streamDeclarations exactly.
Configure the integration in Push
In the Push admin console, go to Settings > Integrations, find the Microsoft Sentinel tile, and select Connect.
Enter the values you collected, choose which event objects and categories to send, and select Connect. Push delivers events individually as they occur.
Note: Because type and object are reserved words in Azure Monitor, events arrive with those fields renamed to eventType and eventObject, and the unix timestamp becomes an ISO 8601 TimeGenerated.
Verify it's working
To test, you can trigger any event. For example, update an employee record in Push. Then wait a few minutes — the first rows in a new table can take 10 to 15 minutes.
Then query the table from your workspace's Logs page. Note: This is a different location than Settings > Tables, which only manages schemas.
Shell
PushEvents_CL
| sort by TimeGenerated desc
| take 20
If events aren't arriving, check Settings > Webhooks > Debug log in Push.
InvalidConfiguration means the tenant ID, client ID, or client secret is wrong, the client secret has expired, or the role assignment is missing.
IllegalResponseCode usually means the endpoint URL, DCR immutable ID, or stream name is wrong or the role assignment hasn't propagated yet.
Legacy integration
These instructions cover the legacy integration option for Azure Monitor and Microsoft Sentinel to ingest Push webhook logs.
Overview of legacy integration setup steps:
Create a Log Analytics workspace in Sentinel if you haven’t already.
Retrieve relevant keys from Log Analytics workspace.
Complete the integration in the Push admin console.
Once the integration is complete, a log table will automatically be created within Sentinel.
Important! Do not create a custom log table, as this will cause the integration to fail.
Create a Log Analytics workspace
First, determine if you already have an existing Log Analytics workspace configured within Sentinel. If you have an existing workspace, you can skip the following steps 1-8. Go to the section titled Retrieve keys from Log Analytics workspace and start there.
If you don't have an existing workspace, you'll need to create one. Here's how.
1. Navigate to Log Analytics workspaces and click +Create.
2. Select or create a Resource group with the appropriate permissions.
3. Click Review + Create.
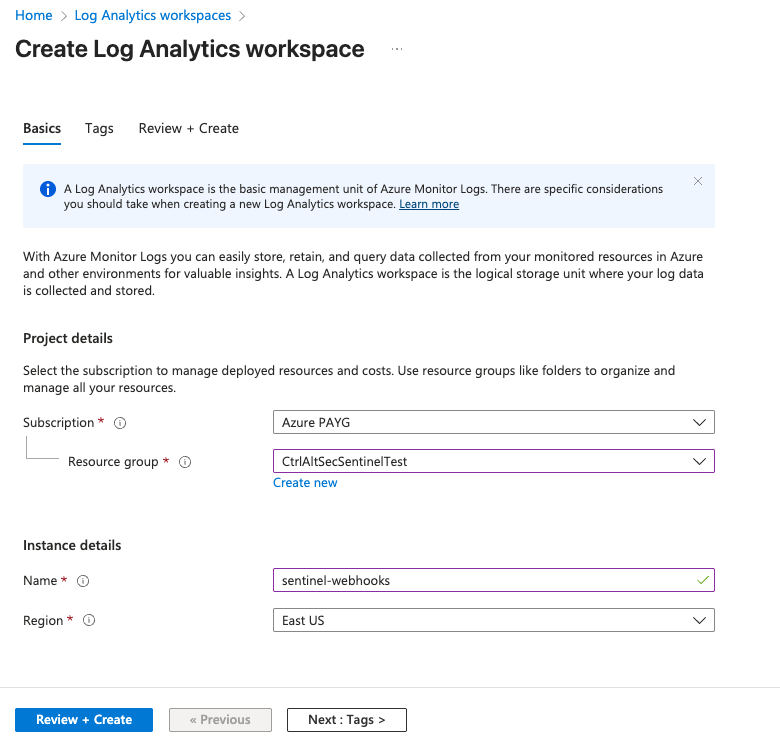
4. Click Create.
5. Wait for the deployment to complete.
6. Next, you'll add the Log Analytics workspace to Sentinel by going to Sentinel, then select +Create.
7. Choose the Log Analytics workspace you just created.
8. Click Add.
Retrieve keys from Log Analytics workspace
Once the workspace has been created, you're ready to retrieve keys from Azure.
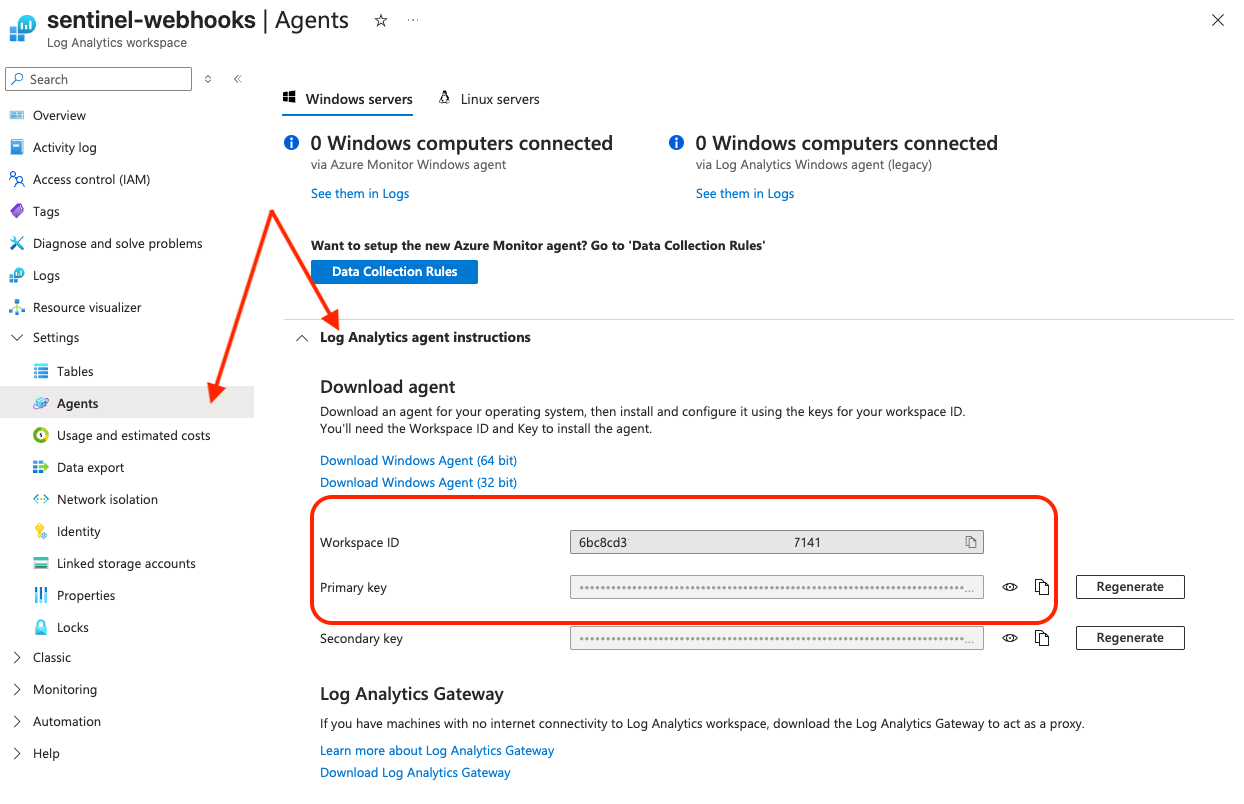
Within Azure, go to Log Analytics workspaces.
1. Select your workspace.
2. Then go to Settings > Agents > Log Analytics agent instructions.
3. Copy the Workspace ID and Primary key.
Configure the integration in Push
Finally, you need to set up the Microsoft Sentinel integration in the Push admin console. Go to Settings > Integrations and choose Sentinel.
Input the Workspace ID and Primary key (Workspace key), and create a new log table name.
Important! Do not use an existing log table name. This will cause the integration to fail. A table will be created automatically when you create a new log table name.
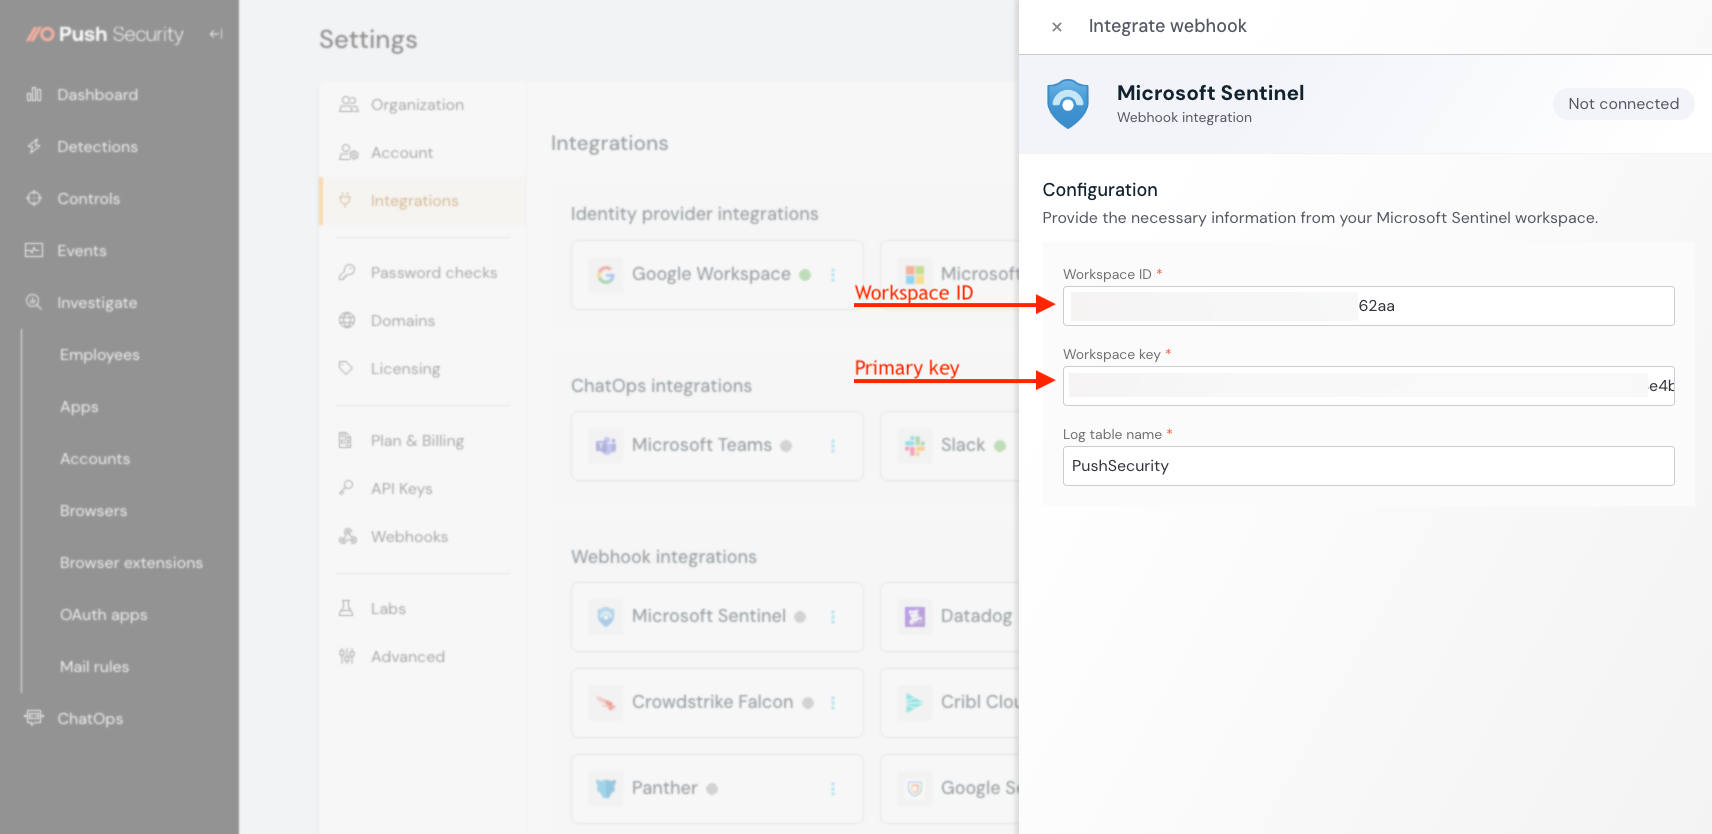
The new table will appear in Microsoft Sentinel under General > Logs within the new table you created. The table will automatically have “_CL” appended to it (e.g. PushSecurity_CL).