Attack timeline, screenshots & classifications for Detections, blog cloned login pages, and more.
Attack timeline, screenshots & classifications for Detections, blog cloned login pages, and more.
What’s new this month:
Attack timeline, screenshots & classifications for Detections
Block cloned login pages
Block URL schema obfuscation
Identify browsers synced to personal profiles
Enhanced dashboard
Configure a custom data retention period
Debug logs for SIEM & webhooks integrations
Attack timeline, screenshots & classifications for Detections
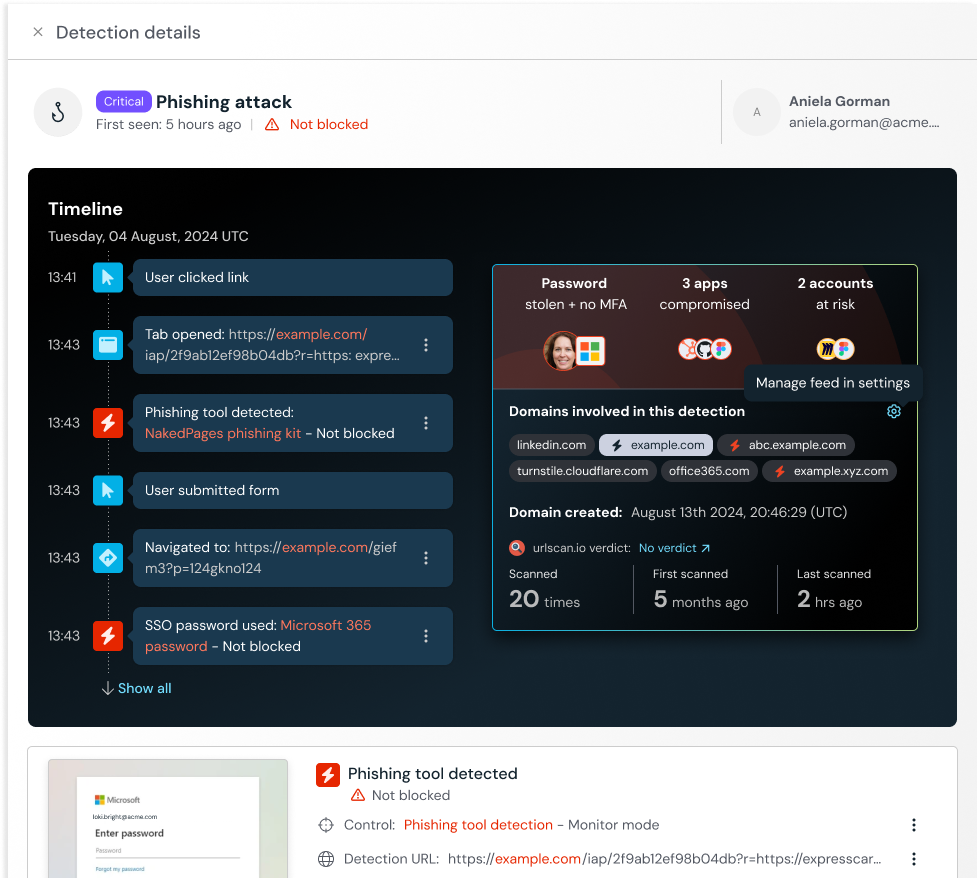
You can now get deeper context and telemetry to investigate attacks that Push intercepts in the browser using these recently released enrichments for Push’s Detections:
Timeline: An attack timeline of where a phishing link originated, how a user interacted with the page, and how Push responded.
Screenshots: Optional screenshots of the suspicious page, to quickly triage detections.
Blast radius: A view of the impact of this attack and whether other apps are also compromised or at risk as a result.
You can also now classify a detection to record the outcome of your investigation. Options include: true positive, benign true positive (such as a detection triggered by a phishing simulation exercise), and false positive. The default state is not classified.
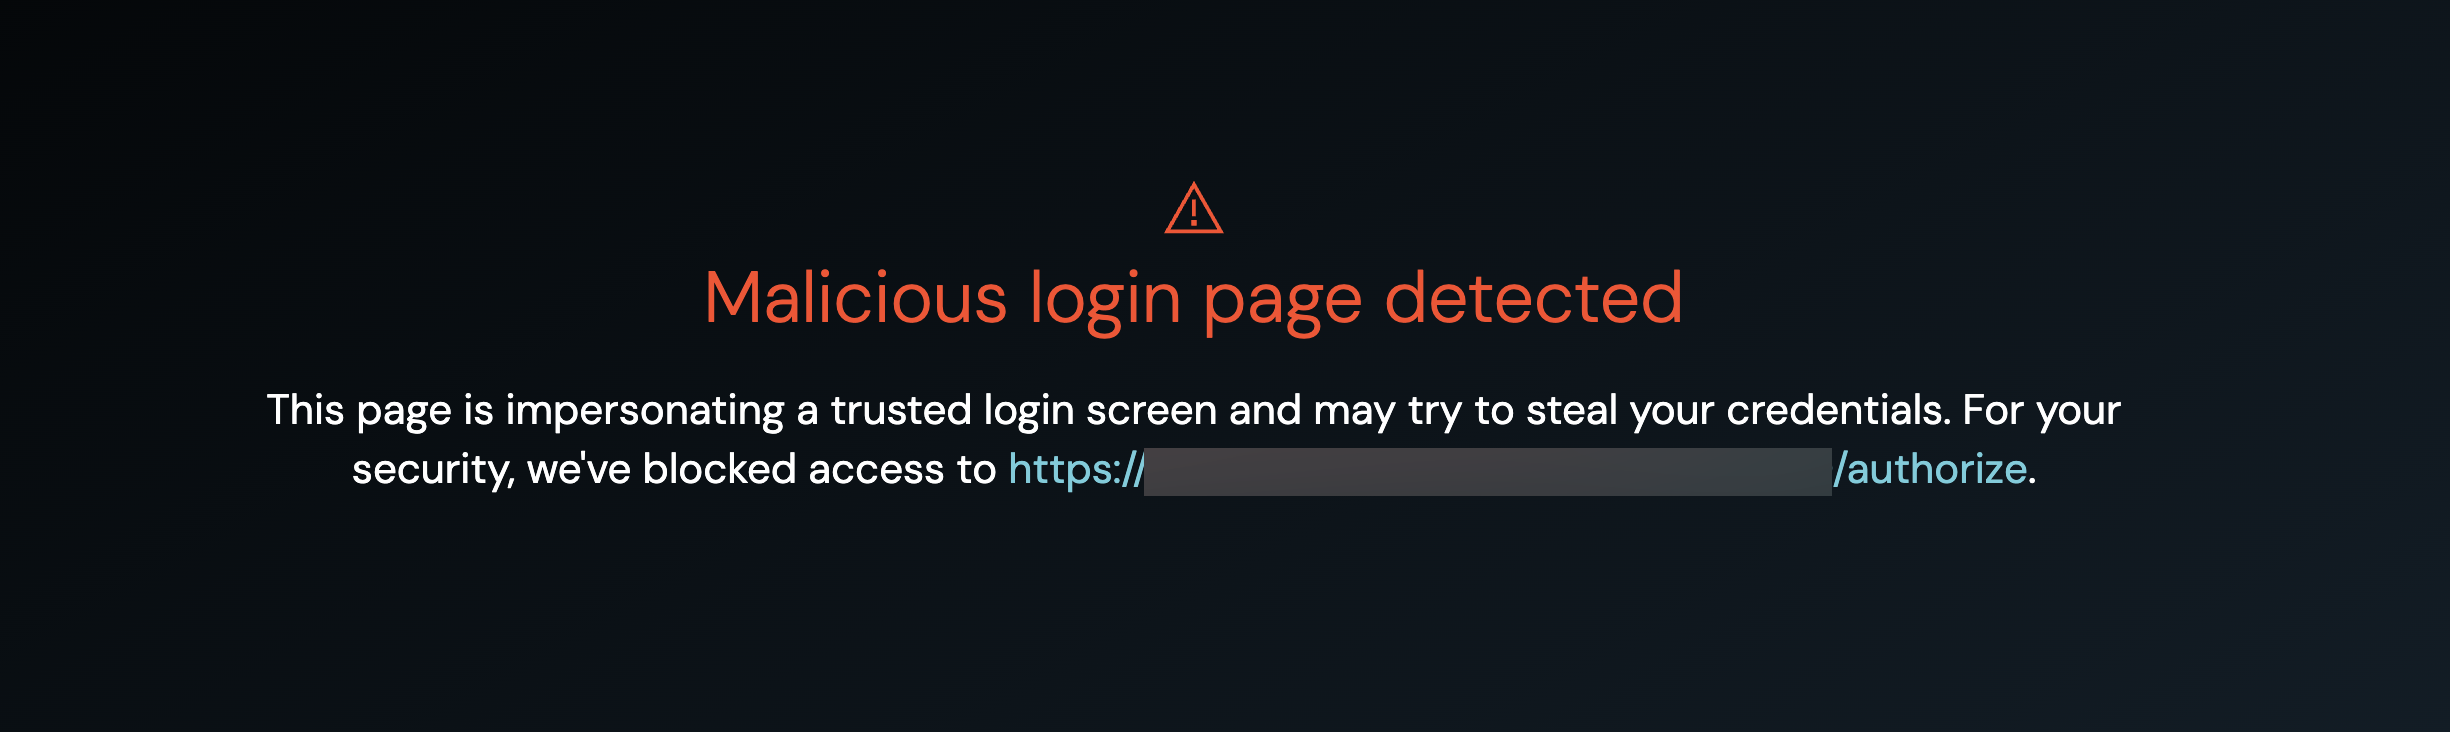
Block cloned login pages
You can now Warn or Block employees when Push detects that they’re visiting a cloned login page.
Cloned login page detection, which you can configure on the Controls page of the Push admin console, has become a highly effective and low false-positive control. We recommend that you move to using Block mode for your organization — if you’re not already!
Identify browsers synced to personal profiles
The Push browser extension can now identify the email address that’s used to log in to a browser, as well as whether browser sync is enabled.
Using this data, you can see whether any employees are signed in to work browsers with non-company identities and syncing their browsers, which can result in work credentials being synced to personal profiles.
To find this data, go to the Push admin console and view the Browsers page under Investigate in the left toolbar.
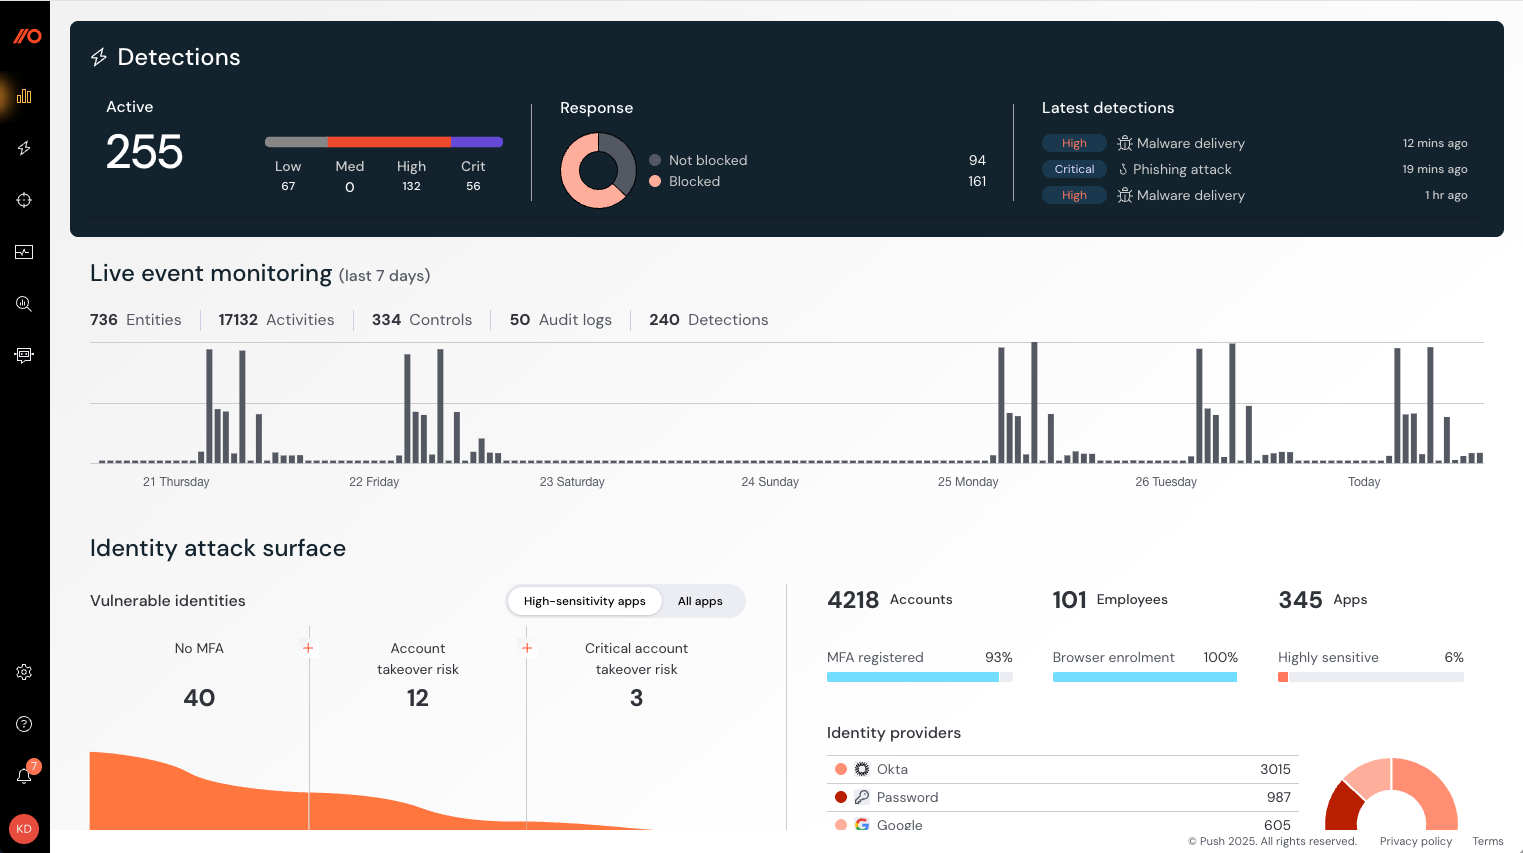
Enhanced dashboard for easier monitoring
We’ve improved the data and design of the Push admin console Dashboard so you can keep track of the important developments in your environment.
A few of the changes:
A snapshot of recent Detections activity
An overview of all events on the platform, including activity related to Controls
Performance improvements so the page load is fast for even very large deployments
Configure a custom data retention period
You can now configure how long activity data will be retained in Push by configuring a data retention period.
From the admin console, go to Settings > Organization > Data retention and select the data retention period in years.
Easier debugging for webhook or integration error messages
We’ve added a debug log to make it easier to see what’s not working when you receive an error related to your Push webhooks or SIEM integrations.
You can access the debug log by opening the details slideout in the Push admin console for the webhook or integration you’ve created. Go to Settings > Webhooks or Settings > Integrations.