How do I access the debug page for the Push browser extension?
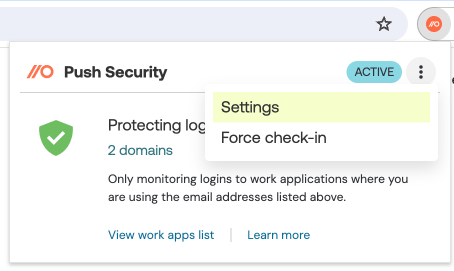
You can view debug information for the Push browser extension by accessing a settings page linked from the extension popup in your enrolled browser.
If you’re working with the Push team to troubleshoot an issue, you may need to send this information to us.
1. Click on the browser extension icon. If the icon isn’t pinned, you may need to open the list of extensions you have installed for that browser.
2. Click the three dots in the top right corner for the Push extension and select Settings.

3. Use the Save as PDF or Copy to clipboard buttons in the top left corner to capture the information.